|
|
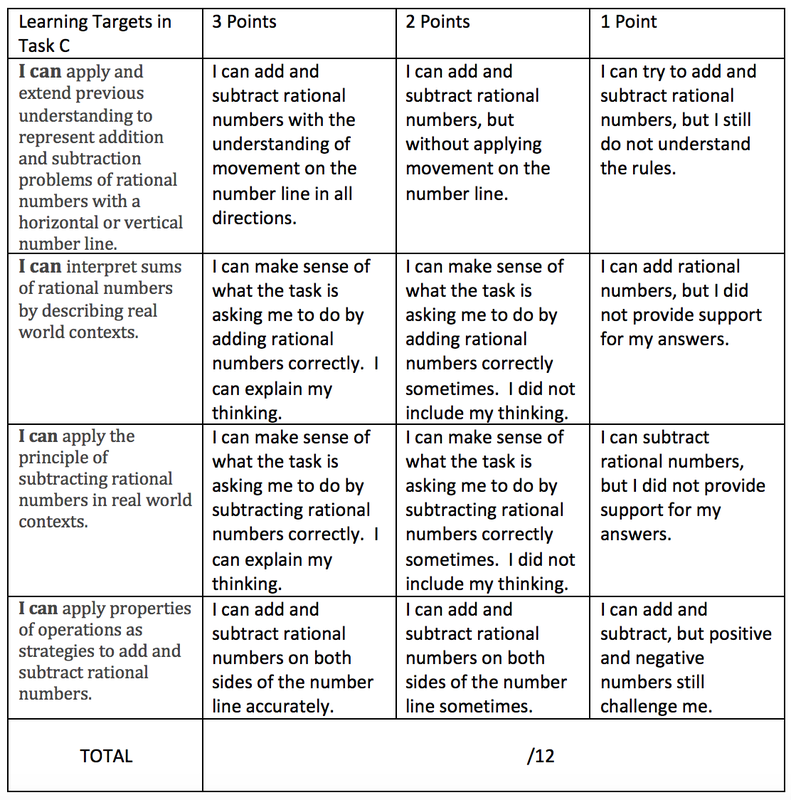
Directions: You can earn up to 12 points on this activity.
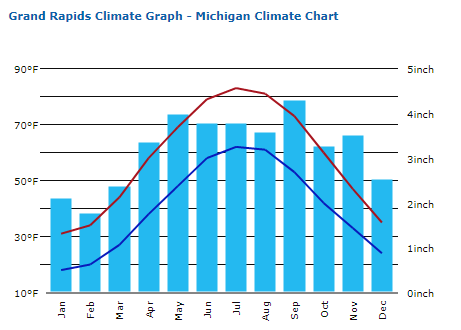
This is a graph of the climate in Grand Rapids over the course of a whole year or 12 months. As we are aware, Michigan goes through seasons that change the temperature and the amount of precipitation. Refer to the graph below to answer the questions. Be careful because making sense of a graph can be tough. Make sure to know what everything in the graph represents before you begin. Answer all questions on your recording sheet to the best of your ability.
This is a graph of the climate in Grand Rapids over the course of a whole year or 12 months. As we are aware, Michigan goes through seasons that change the temperature and the amount of precipitation. Refer to the graph below to answer the questions. Be careful because making sense of a graph can be tough. Make sure to know what everything in the graph represents before you begin. Answer all questions on your recording sheet to the best of your ability.
|
As you can see, the climate in Grand Rapids is always changing. Look at the graph above to answer the questions below.
|

Looking at the Numbers
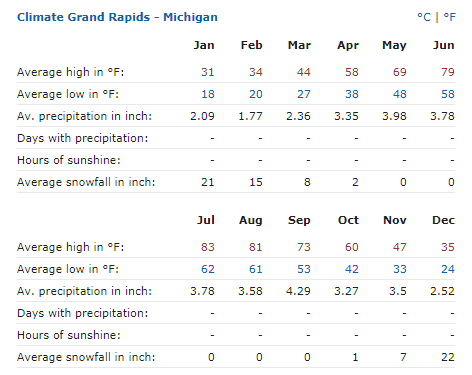
This is the average temperature in Grand Rapids from January to December. This takes many years of recording the temperature to conclude this data. Look up this current week's weather. Compare this week's temperature with the average for the month. Are the temperatures above or below the average? Why does this information matter?
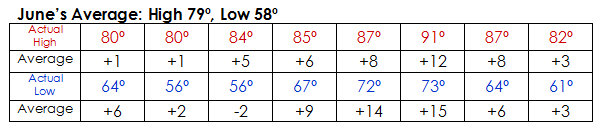
Use the example below.
This Week's Forecast
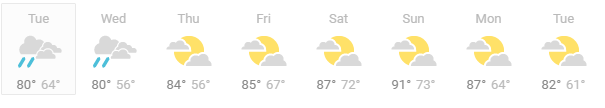
Using this week's weather data and the average, make a table comparing the temperatures. Include the highs and the lows in your comparison.
- Choose Grand Rapids weather to compare to the Michigan averages above.
- Use this week's weather and compare to the averages.
- Choose a different city in Michigan to look at this week's weather.
- Make the same average comparisons to the average.
- Then, compare this week's weather in Grand Rapids to the city you chose.
- What did you notice? What would happen if you looked at Houghton, MI?
